6H-SiC(0001) based calibration sample is designed to perform easy calibrations of AFM scanner vertical movement in several nanometers interval. The simplicity of calibration process is provided by nearly uniform distribution of monolayer high (1.5 nm) steps on the sample surface demonstrating chemical and mechanical stability. The step height corresponds to the lattice constant of 6H-SiC crystal in [0001] direction.
Specification:
- Chip size – 5x5x0.3 mm3
- Average interstep distance – 0.2-0.5 µm
- Misorientation of surface ~ 0.3°
- Average roughness of the area between steps (terraces) – 0.09 nm
- Single step height 1.5nm.
Calibration in 3 Steps
To calibrate AFM scanner movements along the Z axis the following operations are to be performed:
· Place the SiC/1.5 calibration sample on the flat horizontal working area under the AFM probe.
· Approach the AFM probe to the sample surface and make topography scanning in the height measure mode using the scan size of about 10 um (Fig. 1).

Fig.1 3D AFM image 10x10um
Make sure that there are no impurities on the image and choose for further measurements the area about 1.5x1.5 um2 .
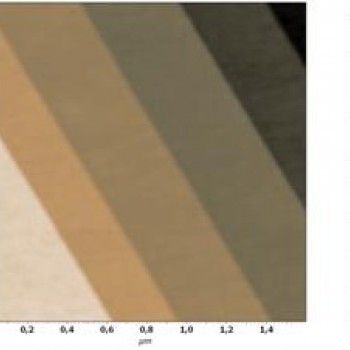
· After obtaining good quality AFM-image of the sample surface with several steps use the software filter to flatten image so that every single step becomes horizontal (Fig. 2). Choose the area on AFM-image for obtaining height spectra by using possibilities of AFM software. Please, choose the area with maximum number of steps for better statistics. After obtaining height spectra with peaks corresponding to each step, measure the interpeak distances. Note that distances between neighboring peaks may vary a little (see Fig.3), so it is useful to average distances between peaks by measuring distance between far standing peaks and dividing the measured value by the number of included interpeak distances (A-A on Fig. 3). Change the scanner calibrating constant while average interpeak distance becomes 1.5 nm.
Fig.2 AFM image 1,6x1,6um Fig.3 Height spectra